


Website speed (also known as “web performance”) is an established tenet of User Experience optimization. Faster websites bounce less, convert better, reduce user frustration, and improve brand perception. Slower websites reduce conversion rates, impact SEO traffic (as page speed is a ranking signal for search engines), and raise paid search ad costs (by negatively impacting quality scores).
Recently, I attended the Performance.now conference in Amsterdam, which is the world’s premier Web Performance event, since 2018. It’s a “who’s who” of the web performance community, including participants who did much of the foundational work and created the tooling many of us in the community use day-to-day.
The subject matter was a mixture of business-focused and technical-focused. I’m going to outline broad opportunities around improving the user experience and understanding the latest innovations. If you would like a more technical deep-dive on any of the points below, please email me at s.mcmillan@astoundcommerce.com and I’d be happy to help.
Interaction to Next Paint (INP)
At the 2022 conference, there was some mention of Interaction to Next Paint (INP), which is a page speed metric measuring the time from when the user interacts with a page (scrolls, clicks, types, etc.) and the time between the page visually updating. At that time, Google had taken feedback from the community, gathering data to understand INP’s impact on user behaviour. Google proposed adding it to the Core Web Vitals set of metrics, which are part of organic search ranking signals. In May 2023, Google confirmed that in March 2024 INP would be added to Core Web Vitals; therefore a poor INP score will negatively impact SEO rankings. Google’s data shows that a poor INP score is negatively impacting your user experience right now, reducing your site’s conversion rate.
How Do I Know If I Have a Problem?
Google anonymously collects page speed data from every website visited using the Chrome browser, called Chrome User Experience (CrUX) data. It’s a publicly available data set that you can look at using BigQuery. Google also makes the data available for any website at PageSpeed Insights:
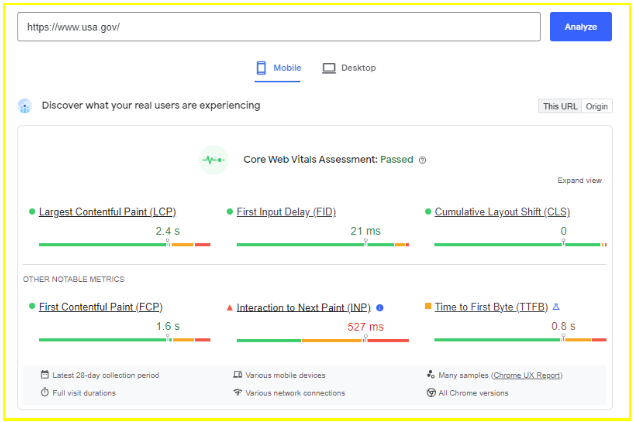
For Google to consider your website to be fast enough, INP has to be below 100ms. We can see that the U.S. government site has some issues; despite passing the existing Core Web Vitals it’s not ready for INP.
What Causes Slow INP
There are nuances to this, but, in essence, slow JavaScript. If your site is heavily JavaScript-dependent, then you are likely to have issues with INP.
What Can be Done to Improve INP?
The real solution is to remove as much JavaScript as possible. At the conference, there was a case study that showed the removal of 95% of JavaScript from a site by replacing it with modern native browser features. A lot of historic JavaScript on websites was written to provide features that the browsers didn’t provide natively; however, recent browser developments mean that many of these features are now built in. A common use of JavaScript is to build (render) elements of the page on the browser instead of on the server. This should be avoided where possible; a presentation from Speedcurve introduced the idea of “content islands'' on a page, where much of the page is static and built on the server, but with islands of progressively enhanced, dynamically loaded (and JavaScript-driven) content. Basically, the whole page doesn’t need to be an app.
INP is going to be a challenge for many websites and needs to be addressed.
Measurement
There was a great talk from Akamai on “Noise Cancelling RUM” (real user monitoring), which highlighted some key cases where your monitoring data may be hiding some complexity. Some of this was quite technical, but there is one example I’d really like to share.
Like me, you’ve probably browsed certain sites, looked at a search or category page and then opened new browser tabs to view the products. It can be a way to compare products without losing your place on the category page. The measurement challenge with this is that because these new tabs are usually opened in the background (that is, the active tab is still the category page), the browser doesn’t allocate as many resources for loading these tabs. That means that these tabs load slower, and therefore add slower data to your monitoring.
So What, I Hear You Ask?
Well, this data might lead you to falsely conclude that you have slow category pages when you don’t. What you may have is a user experience problem where users feel they need to open new tabs to efficiently browse products, and that’s the real problem you should be solving.
The Digital Divide
Gov.uk gave an insightful presentation on the digital divide in society. The headline number is that there are 7 million households in the UK without broadband. These may be people in financial hardship who cannot afford broadband or the devices to use it, but in many cases, it is people who are in areas of poor connectivity. The map below is of northern England and Southern Scotland; orange dots are areas with broadband speeds of less than 10Mbps and red dots are less than 2Mbps.
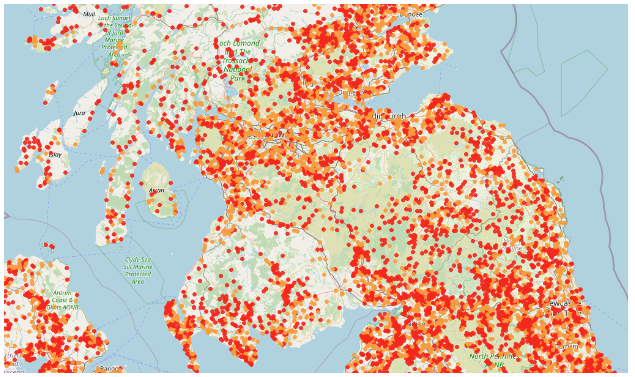
Everyone should be testing their websites on slower connection speeds to ensure that the experience works well for these customers.
Gov.uk also made us aware of the “European Accessibility Act” which will be coming into force in 2025; accessibility needs to be much higher up everyone’s agenda in 2024 to avoid the risk of penalties. Think of this as “the GDPR of accessibility.”
Some Other Points from the Conference
- We need to make sure we favour user experiences over developer experiences
- Data shows that not all pages have equal value in terms of their priority for site speed. From most important to least: product page, category page, home page, cart page, search page.
- The cost of data varies greatly across the globe; some examples of the cost for 1Gb mobile data: US $6, UK $0.62, Germany $2.14, Falkland Islands $40.58
- PWAs save a lot of data. Starbucks's PWA is 99.84% smaller than its native app.
- When we design (landing) pages we need to make sure they represent actual user experiences; the designs need to include cookie banners and pop-ups.
- 92% of businesses think their website UX is costing them sales
- Everyone who touches a page should care about the performance of the page, including those who want to put tags on the page
- Establish competitor leaderboards for site speed. Are you faster than your competitors?
- Your global technology strategy will not work for China. The technology barriers need to be considered separately.
Hopefully, I’ve shown that there is a lot happening in the world of web performance and a lot that can be done to improve your users’ experiences. But there is a lot to it, so do get in touch with us if you want to understand the opportunities available for your site. Here at Astound, we have long understood the relationship between web performance and bottom-line business success. We have a range of services from auditing to monitoring to education, which can help you exceed your web performance aspirations.